Ontario’s Electricity System is one of the cleanest systems in North America. We were among the first areas to eliminate coal from our supply mix and throughout the Province, systems are getting smarter and more reliable. Niagara-on-the-Lake Hydro is among the leaders of investing into our own system, installing smart switches and increasing the voltage along our lines to reduce line loss.
Supply Mix
The following are the sources of Ontario’s Electricity System (OEB LINK)
| Electricity Sources | 2024 Mix | 2025 Mix |
|---|---|---|
| Nuclear Energy | 48.5% | 46.2% |
| Water (Hydro-Electric) Power | 23.4% | 22.5% |
| Alternative Power Sources | 11.6% | 11.8% |
| Solar | 2.2% | 2.1% |
| Wind | 9.0% | 9.3% |
| Bioenergy | 0.4% | 0.4% |
| Natural Gas* / Oil / Other | 16.6% | 19.4% |
| Storage | – | 0.1% |
*Includes Lennox and dual fuel (natural gas/bioenergy) and non-contracted emitting generation consistent with IESO.
Figures do not account for the sale and retirement of Clean Energy Credits (CECs).
May not add to 100% due to rounding.
To fulfill the requirements of the Regulation, the OEB presents the information in percentages. To support the changes the IESO has made to the presentation of their distribution-connected data, the supply mix data in the table below is also presented in Terawatt-hours (TWh).
2025 Electricity Facts – System-Wide Generation TWh
| Electricity Source | Tx-Connected | Dx-Connected | Total |
|---|---|---|---|
| Nuclear | 78.3 | – | 78.3 |
| Water Power | 37.4 | 0.7 | 38.1 |
| Natural Gas*/Oil/Other | 31.4 | 1.4 | 32.8 |
| Wind | 14.1 | 1.6 | 15.7 |
| Solar PV | 0.7 | 2.9 | 3.6 |
| Bioenergy | 0.4 | 0.2 | 0.6 |
| Storage | 0.2 | – | 0.2 |
| Total | 162.5 | 6.8 | 169.3 |
Note: Components may not sum to the total due to rounding. Figures do not account for the sale and retirement of Clean Energy Credits (CECs)
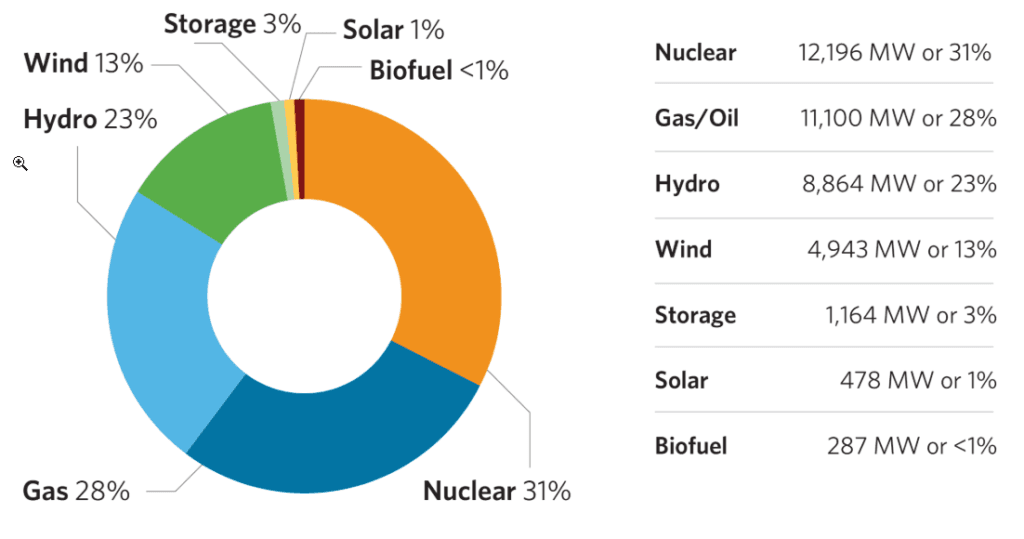
Installed Capacity – Updated June 18, 2026
The following is the breakdown of installed capacity in the Province in released on June 18, 2026 (figures taken from the IESO).
The System
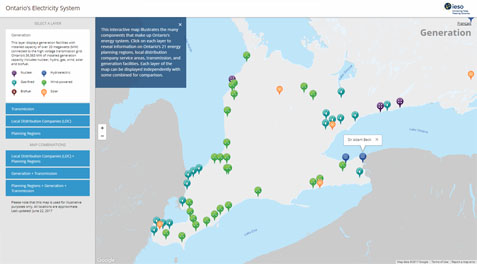
The Province has an array of transmission lines that take electricity from generators to local distribution companies (LDCs). The province is grouped into several regions with their unique levels of requirements. For an interactive map of Ontario’s Electricity system that shows how they co-exist.
If there is anything about the grid that you’d like to know more about, let us know.